
Knowledge graph overview
Understand how ctx| turns repositories into an organization-scoped graph of systems, claims, and relationships.
The knowledge graph is ctx|'s structured model of an organization. It turns indexed repositories and repo-native documentation into nodes and relationships that Chat and MCP can use for technical reasoning.
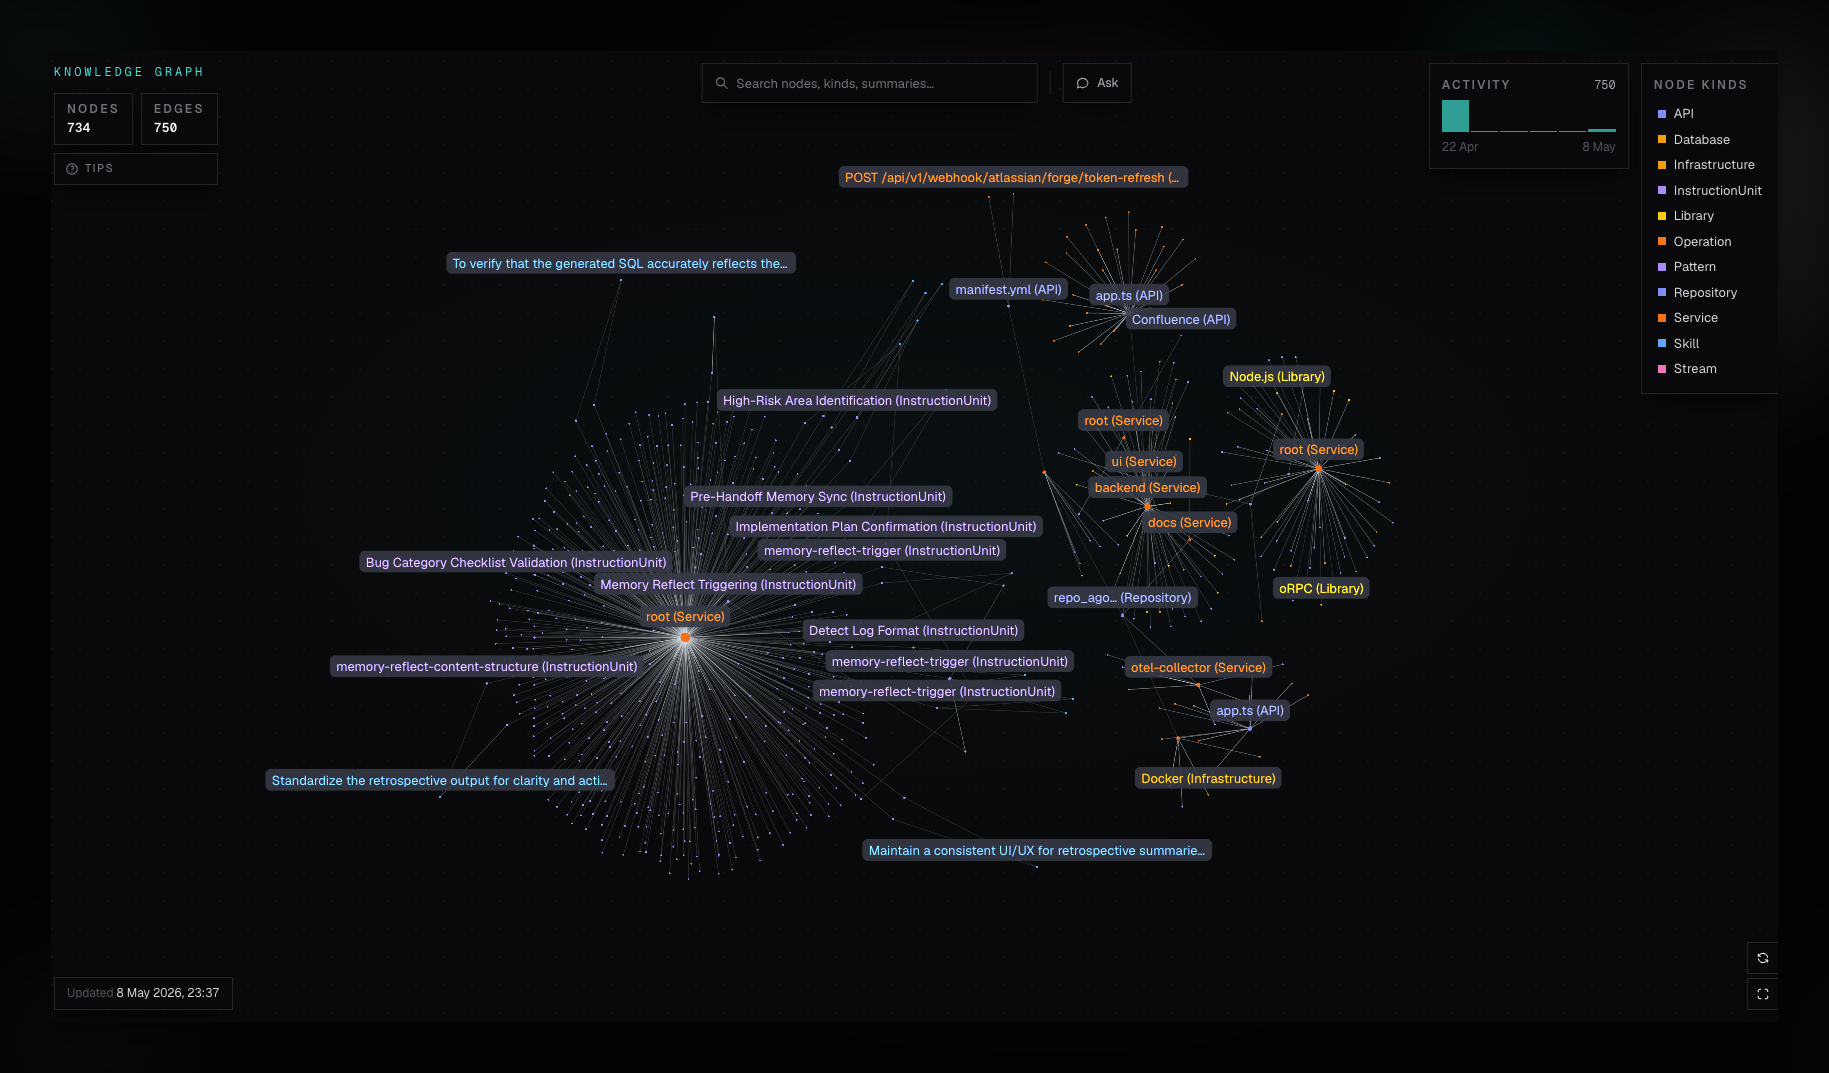
What the Graph Represents
The graph is built from extracted claims. A claim connects a subject to an object with a predicate, timestamp, and confidence.
Node kinds are grouped by what they describe:
- Structure:
Repository,Service,App,Library,API,Operation,Database,Stream,Infrastructure, andFile(a location for any extracted repo path, shared by source extraction and pull requests). - Change:
PullRequest, withADDED/MODIFIED/REMOVED/RENAMEDedges onto files, dated at merge. - Work and discussion:
Issue(Linear),Thread(captured Slack threads). - Knowledge and norms:
Decision(ADR files),InstructionUnit,Skill,Pattern. - Ownership:
Team(CODEOWNERS, tracker teams).
Edges belong to relation families with fixed meanings: containment
(PART_OF), provenance (DECLARED_IN), change (TARGETS, ADDED, …),
reference (REFERENCES, MENTIONS, SUPERSEDES), ownership (OWNS), and
cause (INFLUENCES), alongside the structural predicates such as
DEPENDS_ON, EXPOSES_API, and USES_LIBRARY. Cross-tool edges are
deterministic: an issue that links a pull request, a thread that links an
issue, or a pull request whose title names an issue is joined by URL or
identifier, never guessed.
Where It Comes From
The graph is populated during repository ingestion:
- A repository is registered under an organization.
- Codesearch clones and indexes the source tree.
- Model-assisted ingestion extracts entities and claims.
- The graph database stores those claims in an org-isolated graph.
- The UI reads a graph snapshot for exploration.
See Ingestion explanation for the full pipeline.
How It Is Used
The graph powers three product surfaces:
- Knowledge graph UI: visual exploration under
/:orgSlug/knowledge-graph. - Chat: natural-language questions over graph context and source code.
- MCP:
ctx_advisoruses graph and repository context for agent workflows.
How to read graph claims
The graph is a discovery aid, not an authoritative inventory. A relationship is an extracted claim supported by observations from connected sources. Confidence and freshness help you decide where to investigate, but they do not replace the source.
When a claim matters:
- inspect its connected nodes and observations,
- use Ask ctx| to request an explanation and supporting files,
- distinguish what was found in source from what the model inferred,
- and verify behavior in the current code before making a risky change.
Large organization graphs may be shown as a subset. Search and node-kind filters help narrow the view; the totals and Subset shown indicator make truncation explicit.
Graph health
GET /:orgSlug/api/v1/knowledge-graph/quality reports join density (the
share of nodes whose evidence comes from two or more extractors), the orphan
rate, evidence rows per claim, and the count of leftover instruction units that
were derived from connector Markdown. A manual re-index is a full rebuild: it
re-reads the repository at its current commit and retracts what the repository
no longer asserts, so those leftover units and other unobserved evidence go
away with the run.